Topic
#frontend
Loot, blog posts and adjacent themes connected to this topic. Follow the tag to keep it in your orbit.
2Shown loot
0Shown articles
6Linked neighbor tags
Topic paths
If you want to go deeper, the adjacent tags are the fastest way to compare and branch into related workflows.
Loot
More from this topic
Writemark is a dependency-free web component that renders Markdown while users edit, keeps raw Markdown as the submitted value, and works without a framework or built-in toolbar. Writemark is a small Markdown editor to bookmark when a textarea feels too bare but a full editor framework feels too heavy. It ships as the writemark-editor web component, renders common Markdown patterns while the user edits, and keeps raw Markdown as the canonical value for forms, storage, and application code. The practical angle is control. Your app can provide its own toolbar, upload flow, persistence, validation, and product UI while Writemark handles live inline editing, source/split/preview modes, slash commands, tables, task lists, code blocks, clipboard behavior, and a public action API. The npm package currently lists version 1.3.1, MIT licensing, no runtime dependencies, and npm provenance metadata. Good places to evaluate it: Admin panels and CMS forms that need Markdown without a large editor bundle. Documentation tools where raw Markdown should remain the stored format. AI-assisted writing surfaces that need slash commands and preview behavior without owning a document model. Static or framework-light apps that can use a web component directly. Caveats: Writemark is young, the maintainer describes the parser as handwritten, and it should be tested against your own Markdown edge cases before production use. Treat it as a compact editor primitive, not a drop-in replacement for a full collaborative rich-text stack.
- LinkLoot access
- Free
- Provider costs
- Unknown
Review open

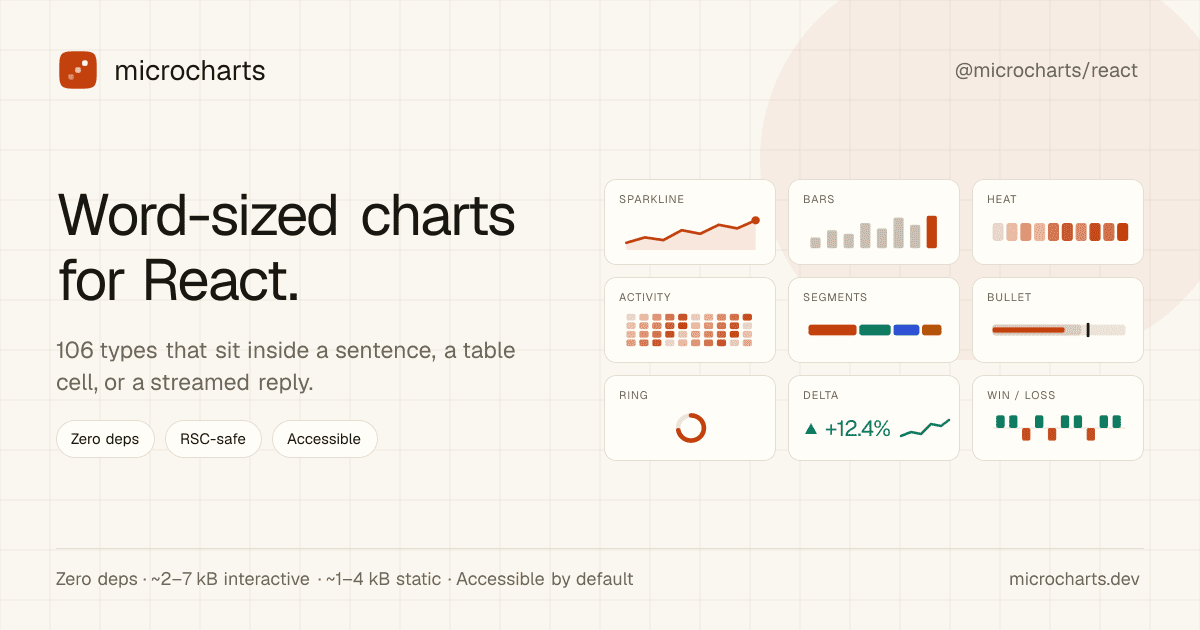
Add Word-Sized React Charts with microcharts
No votes yet
A tiny React chart library for sparklines, KPI cells, tables, and AI-generated UI copy where a full dashboard chart would be too heavy. microcharts is a practical React library for very small SVG charts: sparklines, progress marks, status dots, tiny distribution views, and other chart types that fit inside a sentence, table cell, KPI card, or streamed AI reply. The useful angle is focus. Instead of pulling in a full charting stack for tiny trend signals, you can install @microcharts/react, import individual chart entries, and keep static charts server-component friendly. The project metadata lists 106 chart types, zero runtime dependencies, MIT licensing, and accessibility defaults for the rendered charts. Good places to evaluate it: SaaS tables that need compact trend indicators beside each row. Admin dashboards where a KPI needs a tiny inline signal, not a full panel. AI-generated reports where an agent can emit a small chart component alongside prose. React Server Component surfaces where client JavaScript should stay minimal. Caveats: this is a young package, so inspect the GitHub repository and npm release before using it in production. It is not meant to replace Recharts, Chart.js, or another full charting library for rich analytical dashboards. Treat it as a compact UI primitive for small, source-backed signals.
- LinkLoot access
- Free
- Provider costs
- Unknown
Review open
Blog
Related reads
No blog posts for #frontend yet
There is no published article with this tag right now. Browse the blog for adjacent themes or follow the tag for future updates.