Add Word-Sized React Charts with microcharts
A tiny React chart library for sparklines, KPI cells, tables, and AI-generated UI copy where a full dashboard chart would be too heavy.
- LinkLoot access
- Free
- Provider costs
- Unknown

What you get from it
Practical testing not documented.
LinkLoot assessment · not a user rating.
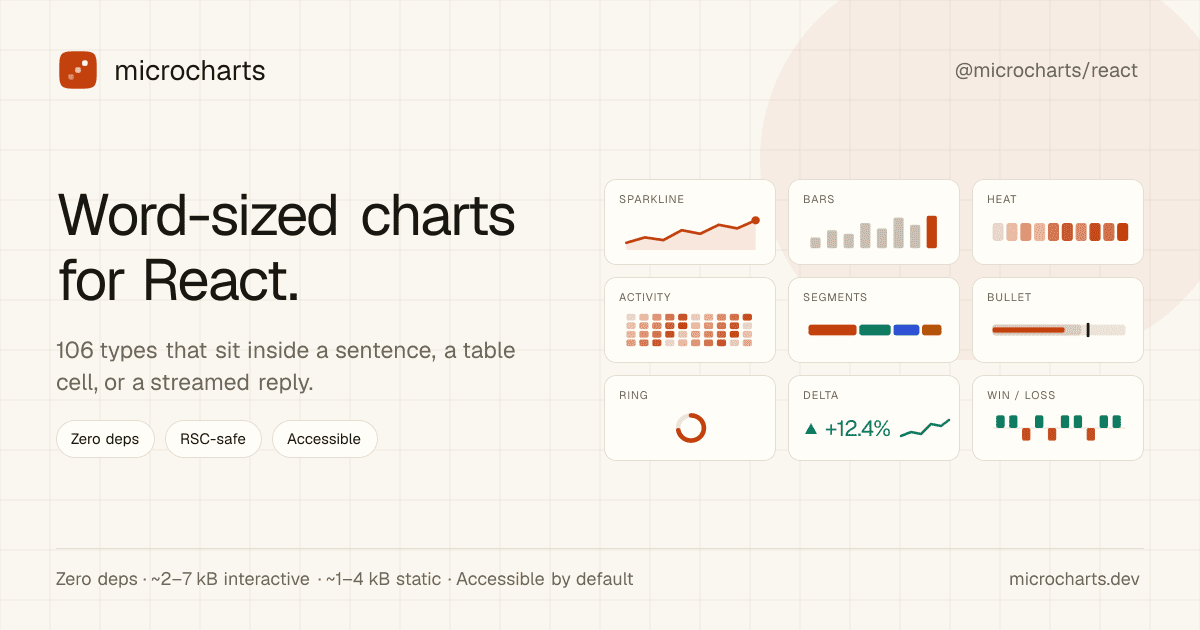
microcharts is a practical React library for very small SVG charts: sparklines, progress marks, status dots, tiny distribution views, and other chart types that fit inside a sentence, table cell, KPI card, or streamed AI reply.
The useful angle is focus. Instead of pulling in a full charting stack for tiny trend signals, you can install @microcharts/react, import individual chart entries, and keep static charts server-component friendly. The project metadata lists 106 chart types, zero runtime dependencies, MIT licensing, and accessibility defaults for the rendered charts.
Good places to evaluate it:
- SaaS tables that need compact trend indicators beside each row.
- Admin dashboards where a KPI needs a tiny inline signal, not a full panel.
- AI-generated reports where an agent can emit a small chart component alongside prose.
- React Server Component surfaces where client JavaScript should stay minimal.
Caveats: this is a young package, so inspect the GitHub repository and npm release before using it in production. It is not meant to replace Recharts, Chart.js, or another full charting library for rich analytical dashboards. Treat it as a compact UI primitive for small, source-backed signals.
Discussion
Share practical experience, questions, or warnings with the community.
Sign in to join the discussion and vote on comments.
Sign in